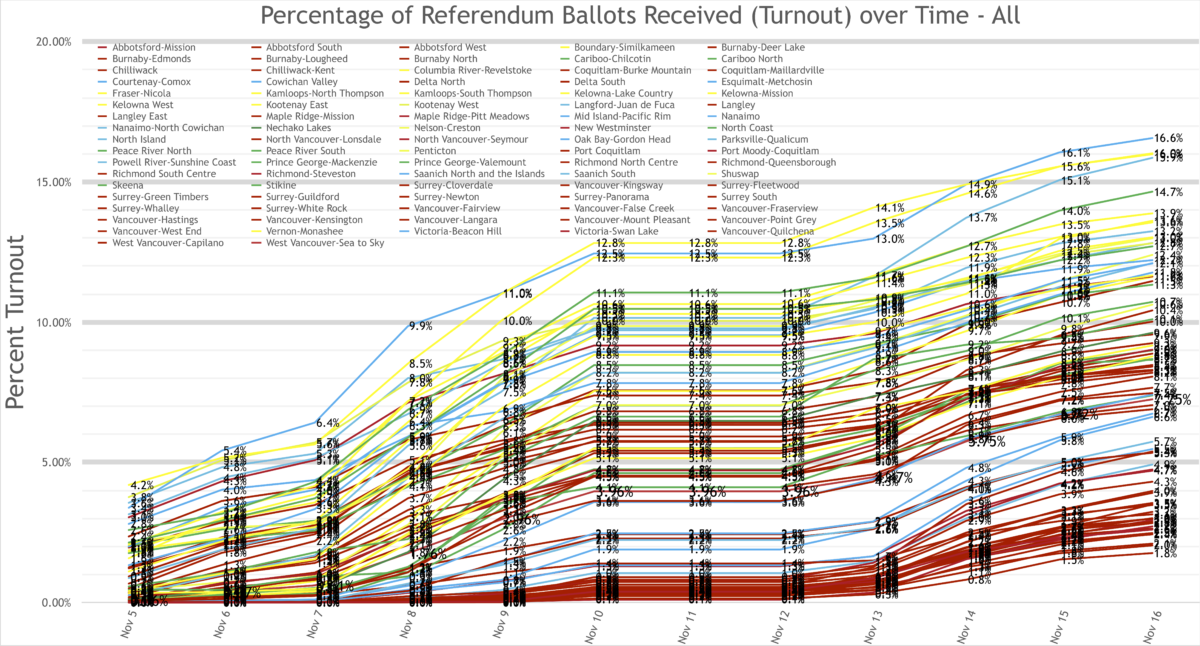
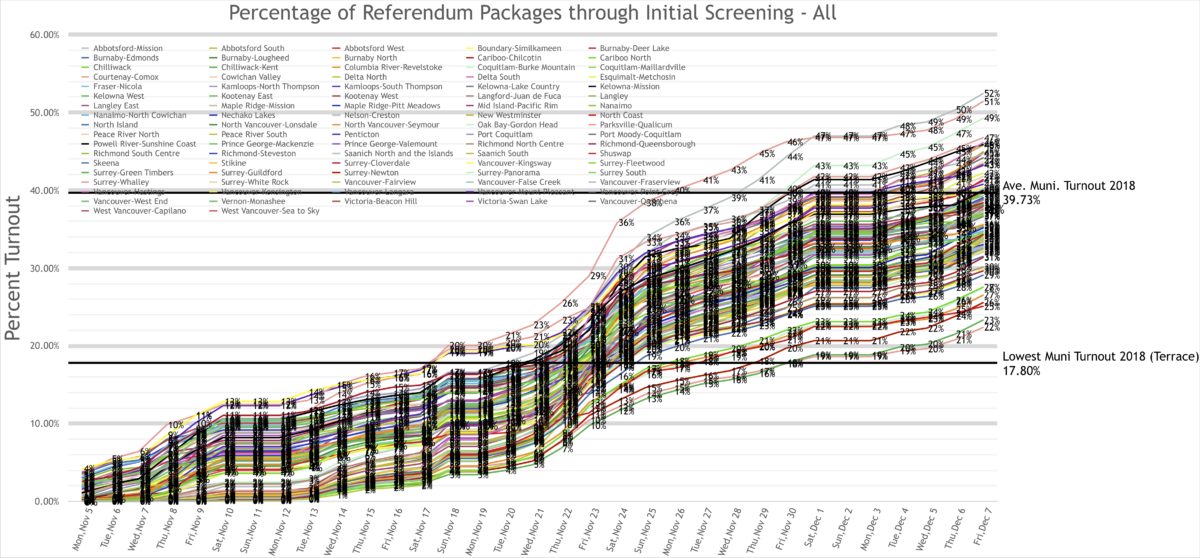
I wrote a blog a few weeks ago poking at the media for making such a big kerfuffle about the “low turnout” in the Referendum after just a few days of data coming back from Elections BC. I noted the differences in numbers indicated a likely connection to patterns in how ballots were mailed out, …
Continue reading “Followup Blog: Graphs from the Referendum”