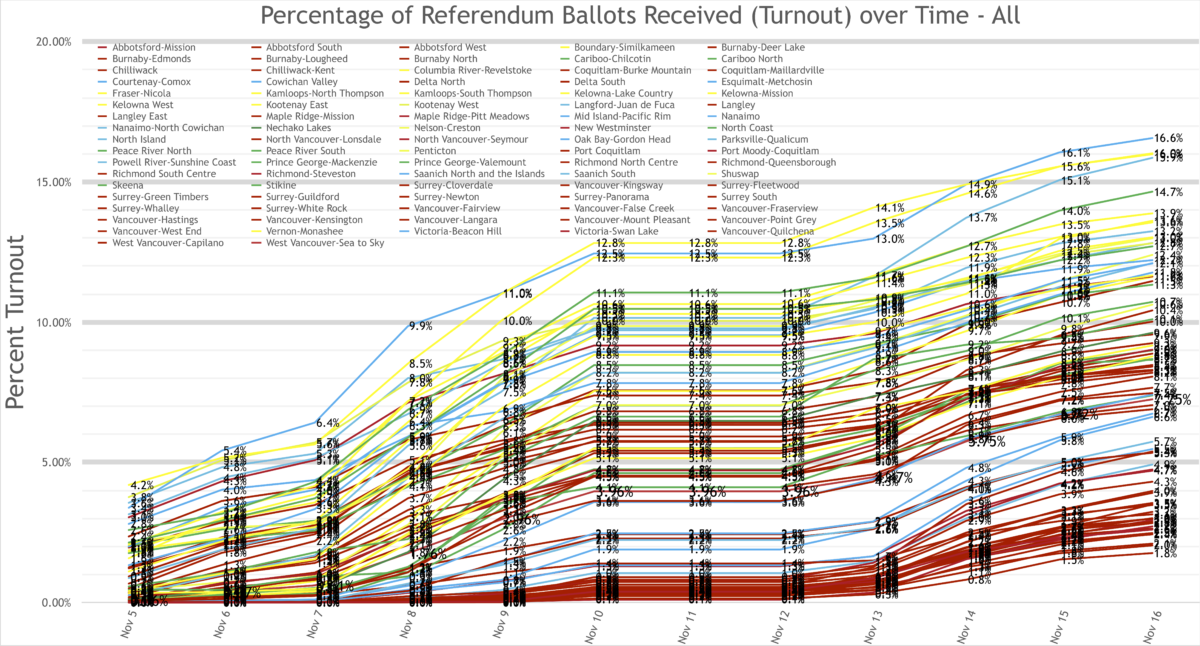
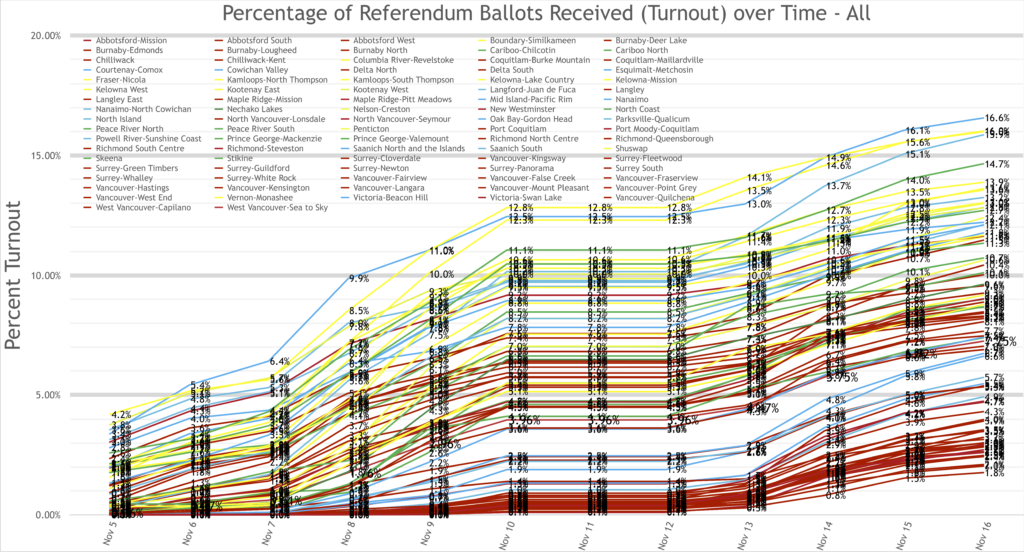
Updated graphs to Nov 16 and Added individual coloured ridings graphs at bottom.
Update 2: Elections BC announces actual packages returned so far.
I see this Global News report that Elections BC is changing the way it is announcing numbers of ballots received. Turns out they have already received almost 20% but the number on the spreadsheets are only those that have passed an initial screening. So it looks like all the hand-wringing was for nothing. So it appears my point is strengthened. It was WAY too early to panic! Elections BC latest update says: “As of 8:20 a.m. November 16, 597,300 packages are estimated to have been received by Elections BC, which reflects approximately 18% returned. This does not include packages that have been received by Canada Post but not yet transferred to Elections BC.”
The amount of hand wringing and hair pulling over the past week as the media has watched the ballot return numbers come in at Elections BC has been intense, and kind of adorable.
We should not fault them for so painstakingly reporting the numbers with every daily update. After all, these are the same media outlets who hang on every ticker refresh on the bottom of our screens on provincial and national election nights as the competitors race toward that imaginary “post” and anchors and analysts trip over themselves to declare winners and losers.
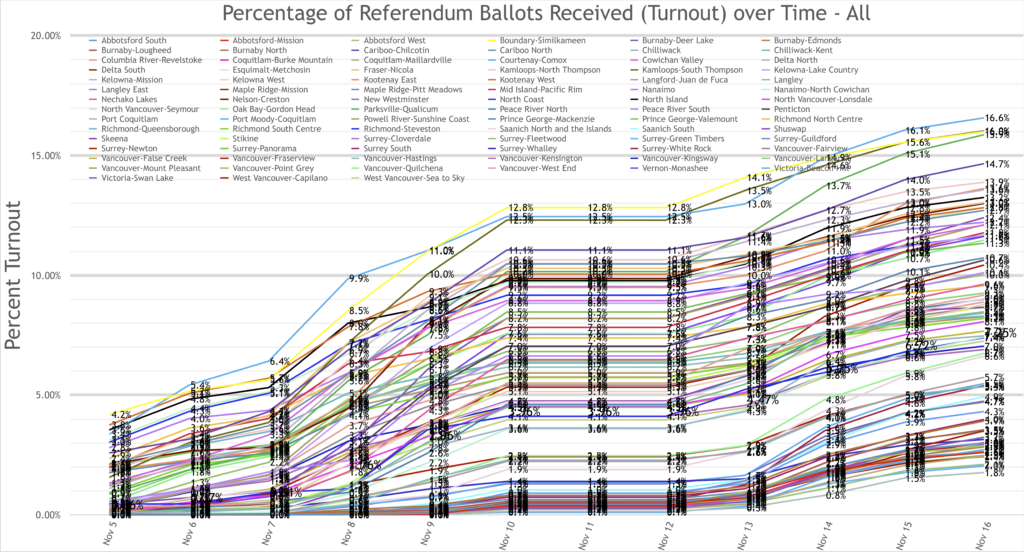
I write this short essay to try to inject a little reality into our situation. It’s still very early days folks. The “polls” haven’t even closed and already we’re decrying the low voter turn out. It’s as if it’s 8:30AM on Election Day. Maybe we should wait at least until an hour or two before those polls close before we start to panic. Here are the numbers so far:
As of today’s (November 15) 8:20AM update (PDF and XLS) and just over two weeks before the scheduled deadline (potential Canada Post related extension notwithstanding), the provincial average return is 7.4% from each riding. Were we expecting 50% by the one hour mark? Let’s look at the province on a riding by riding basis though shall we?
You can download my spreadsheets here in Apple Numbers and Microsoft Excel formats. If you notice any errors please do say so, I am human. 🙂
Elections BC only started counting on November 5th. First out of the gates were Boundary-Similkameen and Kootenay West with nearly 4% of the vote counted in that first “hour” if you will.
Twelve ridings had not reported back at all yet and a bunch more only had tiny returns much like those stragglers and slow starters on election nights who tend to get a late start on things. As of today, those same ridings are at the top still and have been joined by Courtenay-Comox, Parksville-Qualicum and Kamloops-South Thompson. Do you see a pattern?
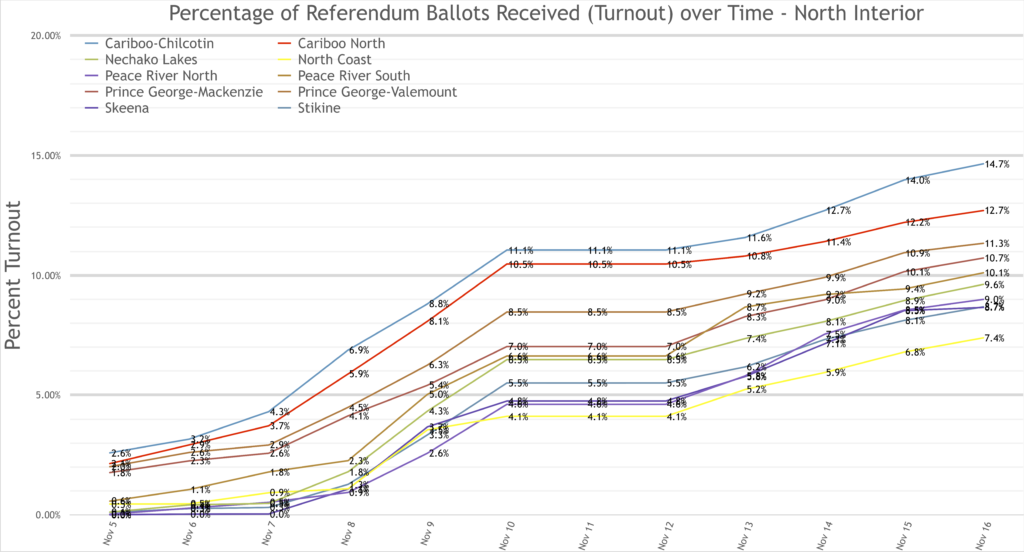
You might notice I’ve grouped the ridings. Red for Lower Mainland, Yellow and Green for the South and North Interior respectively, and Blue for Vancouver Island.
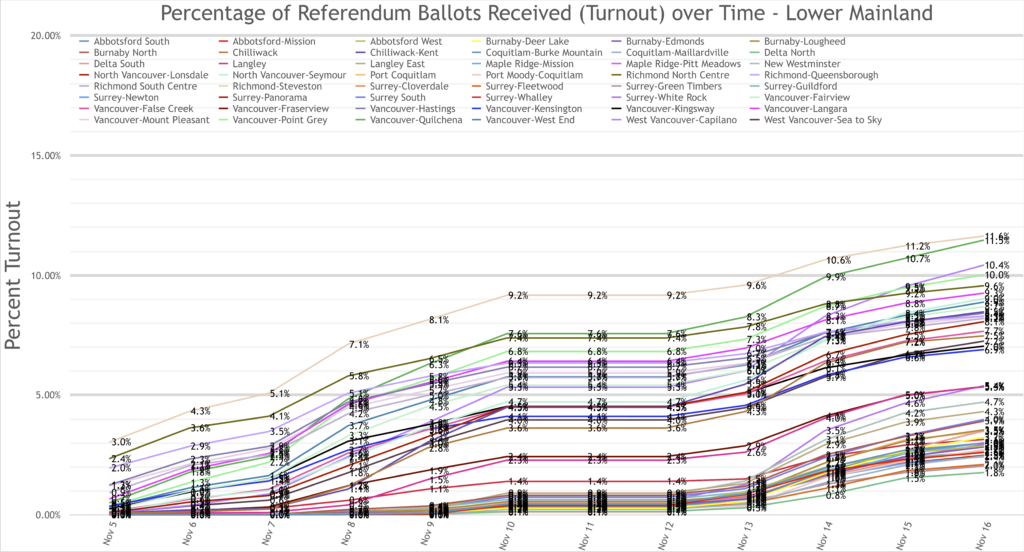
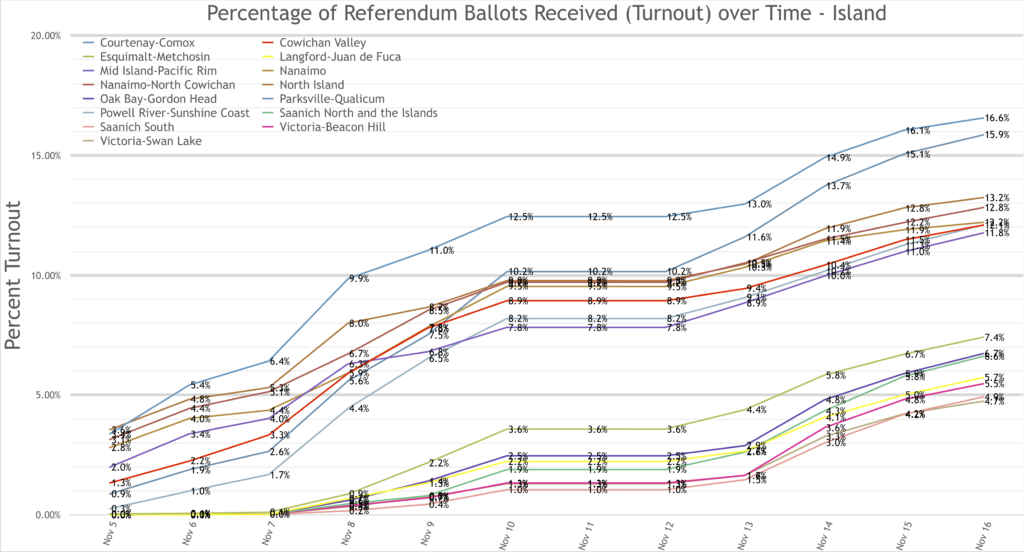
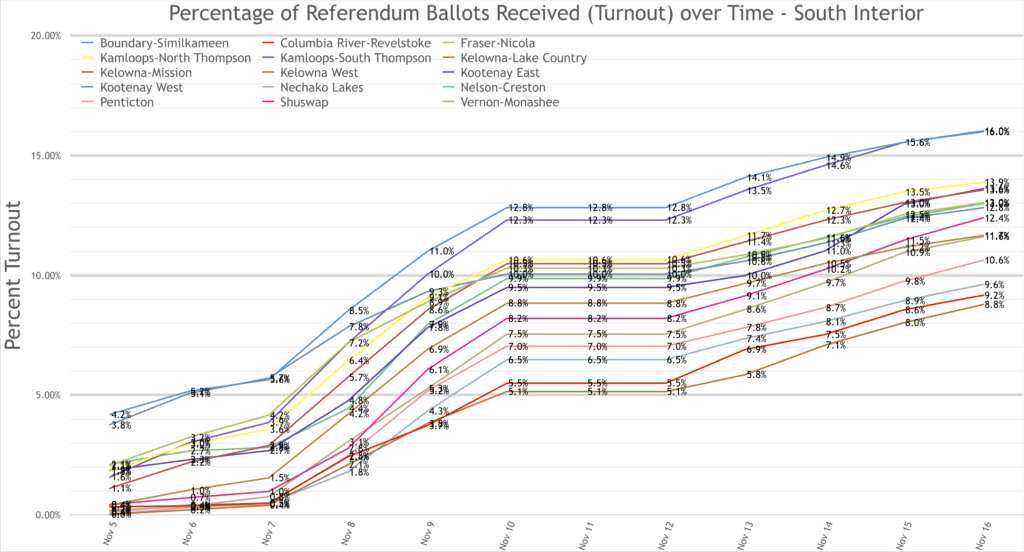
Here are those groups split out:
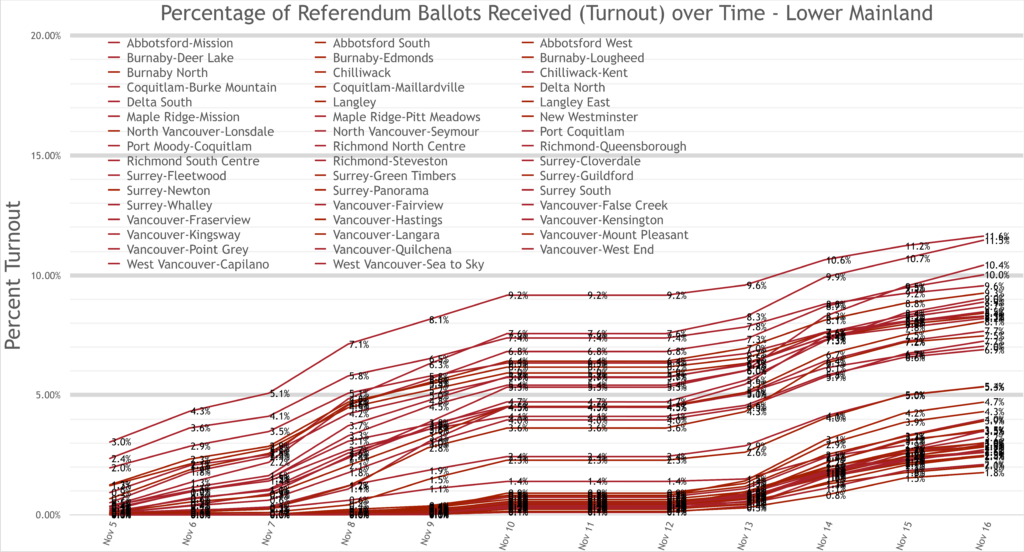
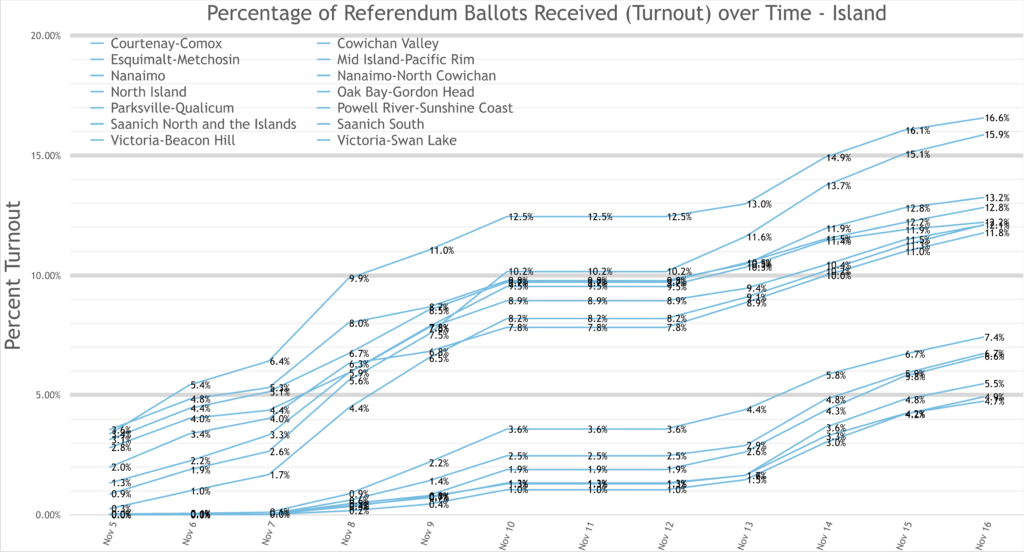
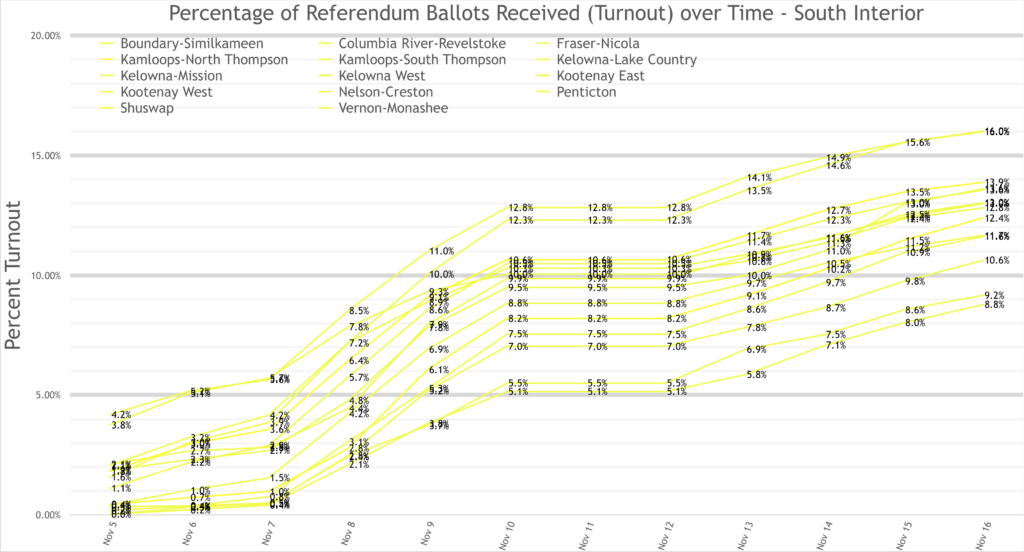
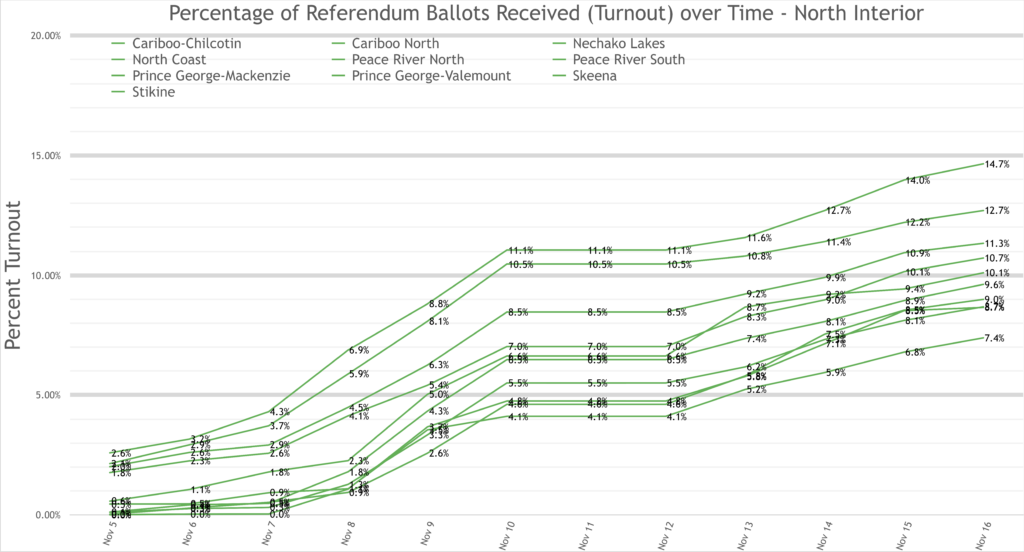
Notice any more patterns? Here’s what I see:
- First off, one should take into account the fact that no ballots were marked as received on Sunday or Monday of the Remembrance Day weekend at all. Lest We Forget that it is a holiday.
- Clearly a large number of Lower Mainland ridings got their packages later than everyone else. It’s the only logical explanation for so many starting at zero and staying very low for the first week while other regions took off.
- Those that did not start at zero in the Lower Mainland were exclusively Vancouver and Richmond ridings.
- Surrey and other Fraser Valley ridings didn’t start returning until the weekend. It is unreasonable to think that hundreds of thousands of people simply left the package on the table when people elsewhere in the province had already started sending theirs in.
- Similarly, on Vancouver Island there is a clear split. The lower group of ridings are all in Greater Victoria whereas the high-return ridings are north of the Malahat including Powell River.
- Finally, if you look at the North and South Interior ridings you’ll see that they are near identical with very similar distribution of returns and with obvious groupings of returns.
So what do we take from all this? I think a reasonable look at the data would conclude it is far too early to scream “LOW TURNOUT” from the hilltops. Packages were obviously not distributed or received at the same time. Returns are now coming in consistently across the province at an average, excluding zero counts, of 0.88% a day which is the same as the average increase for today’s November 15 count across every riding over yesterday.
So rather than declaring a low voter the minute the first ballots come in on election night, or worse, declaring the eventual result to be without merit. Perhaps we should instead sit back, go get another bag of chips or a beer from the fridge, and hang tight for awhile.
We can ignore the analysts (except your humble writer here of course!) and news anchors as they try to fill the empty space while the rest of us go do our civic duty and then come back in a couple hours (or in this case, a couple weeks) and find out what the turnout is like.
So please don’t let the breathless media get you down, just vote, and send in your vote either by Canada Post or at your nearest Service BC outlet so we can all see it be counted.
Individual Riding Graphs
