
This letter appeared in the July 30, 2019 Alberni Valley News (Writer omits some facts about climate emergency)
I must write in response to Mr. Krossa’s letter of July 10 as it is very misleading. The letter stated: “Past levels in the 2000-4000 ppm range did not result in catastrophe for life.â€
As a Workplace Health and Safety representative for my union, I am familiar with air quality standards.
The National Institute for Occupational Health and Safety (source US CDC) lists five minute exposure guidelines for CO2 at 5000 ppm for enclosed areas. If you were sitting in an office with CO2 levels of 2000 ppm, you’d probably feel a little tired, or short of breath. You wouldn’t feel normal.
It was also stated that the Earth has spent most of its existence ice-free, ignoring the implications for sea levels, and the millions, if not billions, of people that would be killed and displaced if the world’s ice caps melted completely.
There is a pattern of deception here with stating some facts while omitting other very crucial ones.
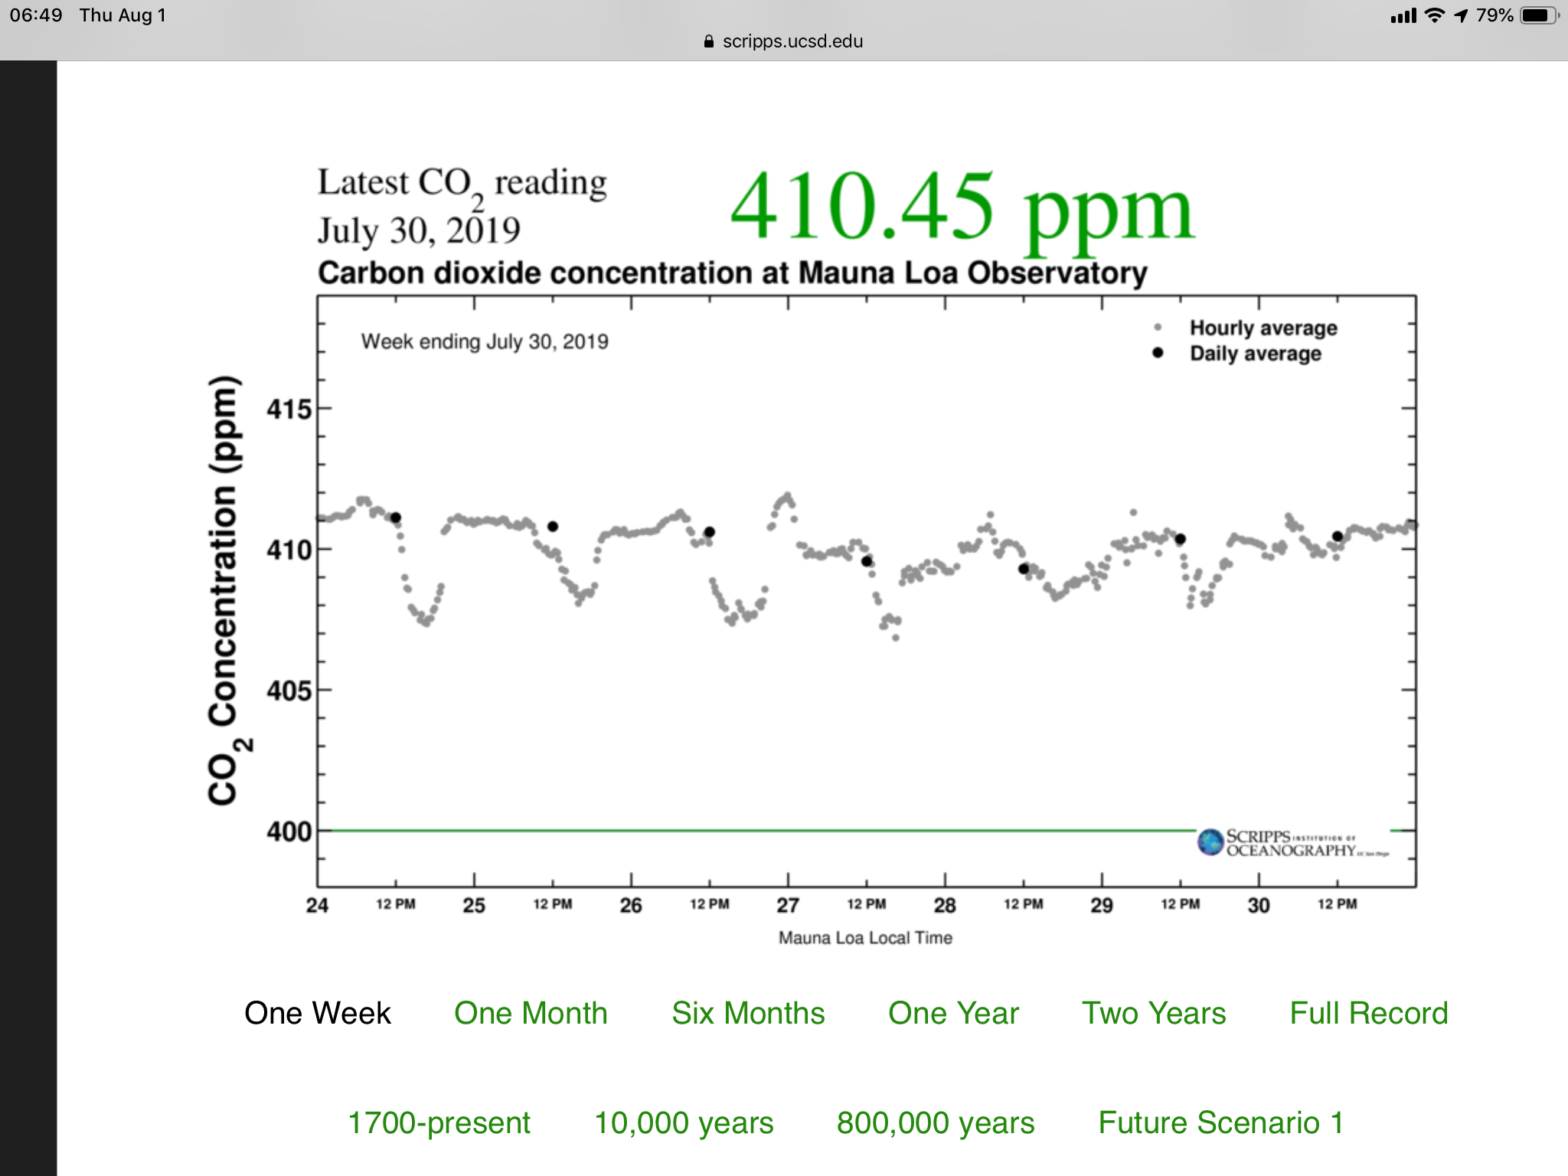
CO2 is normally around 350 ppm outdoors and, according to the Scripps Institution of Oceanography (scrippsco2.ucsd.edu), atmospheric levels have just crossed 400 ppm. Pieter Tans, senior scientist with the National Oceanic and Atmospheric Administration Global Monitoring Division, said in a press release on June 4: “Many proposals have been made to mitigate global warming, but without a rapid decrease of CO2 emissions from fossil fuels they are pretty much futile.â€
I beg the reader to read critically and deeply and to demand immediate action from all levels of leadership. The climate emergency we find ourselves in due to rising CO2 levels from our industry demands it. We have amazing, beneficial solutions at our fingertips that would employ and benefit millions and make our world a more wonderful place, if only we take the issue seriously.
Chris Alemany
P.S. More quotes from that June 4 Press Release:
“It’s critically important to have these accurate, long-term measurements of CO2 in order to understand how quickly fossil fuel pollution is changing our climate,†said Pieter Tans, senior scientist with NOAA’s Global Monitoring Division. “These are measurements of the real atmosphere. They do not depend on any models, but they help us verify climate model projections, which if anything, have underestimated the rapid pace of climate change being observed.â€
The highest monthly mean CO2 value of the year occurs in May, just before plants start to remove large amounts of CO2 from the atmosphere during the northern hemisphere growing season. In the northern fall, winter, and early spring, plants and soils give off CO2, causing levels to rise through May. Charles Keeling was the first to observe this seasonal rise and subsequent fall in CO2 levels embedded within annual increases, a cycle now known as the Keeling Curve. Keeling’s son, geochemist Ralph Keeling, now runs the Scripps program at Mauna Loa.
“The rate of CO2 increase is still very high,†said Ralph Keeling. “We’re likely seeing the effect of mild El Niño conditions on top of record fossil fuel use.â€The Mauna Loa observatory is a benchmark sampling location for CO2. Perched on a barren volcano in the middle of the Pacific Ocean, the observatory is ideally situated for sampling well-mixed air (undisturbed by the influence of local pollution sources or vegetation) that represents the northern hemisphere average. While Mauna Loa recorded a few daily readings above 415 ppm in May, readings from NOAA’s Barrow observatory on Alaska’s North Slope averaged 417.4 ppm in May. The Arctic typically has higher CO2 readings than Mauna Loa and provides a preview of future global average conditions.
Finally if you would like to see the past concentrations of CO2 from the past month, year, or 800,000 years, click the picture.
